


Key takeaways
- Support analytics transforms raw customer interaction data into actionable intelligence, but only when teams move beyond operational reporting and start using data to identify patterns, flag risk, and inform decisions across the organization.
- Most teams are only scratching the surface of what their data contains. Beneath volume and CSAT scores sit unstructured content and AI-enriched signals that reveal far more about customer sentiment, account health, and churn risk.
- A support analytics strategy is only as reliable as the data that feeds it: Inconsistent manual tagging produces trend analysis that reflects categorization habits rather than customer reality.
- The shift from reactive to proactive support analytics is a systems problem that requires clean data, cross-functional routing, and the right metrics.
Support teams generate more customer intelligence than almost any other function in the business. Every ticket, reply thread, and escalation carries signals about product friction, customer behavior, and account health. And most of it never leaves the ticket queue.
The problem isn't a lack of data. It's the absence of a system for turning that data into decisions. Support leaders can intuitively sense when something is wrong based on climbing ticket volume, recurring customer issues, or incoming escalations that shouldn’t be a surprise. But without a clear approach to analyzing and routing that intelligence, those signals disappear into the noise of daily operations.
According to HubSpot's 2024 State of Customer Service, only 32% of customer service leaders use a customer relationship management (CRM) system as their single source of truth for customer experience data, meaning the vast majority make decisions from a fragmented, incomplete picture.
This post covers what support analytics actually means, what ticket data really contains, and how to build a repeatable system for interpreting raw customer service data into a customer experience (CX) strategy that drives measurable outcomes.
What is support analytics?
Support analytics is the process of collecting, analyzing, and interpreting data produced by customer support interactions to improve team performance, customer experience, and business outcomes. The primary source of this data is the ticket queue, but as I'll cover, those signals live in more places than most teams realize.
Support organizations typically operate in one of two modes:
- Operational analytics: A backward-looking model that tracks service-level agreement (SLA) compliance, response time, ticket volume, and overall operational efficiency. Answers the question: How are we already performing?
- Strategic analytics: A forward-looking model that identifies patterns, flags risk, and informs decisions across the broader organization. Answers the question: What is our customer data actually telling us about the business?
It helps to map these modes against the standard types of analytics:
Most support teams are well-versed in the descriptive layer. The others are where the strategic value lives. Support leaders who want to truly understand customer needs, proactively manage customer expectations, and get ahead of customer churn need to shift from an operational to a strategic mindset. That shift is what the rest of this post is about.
What ticket data actually contains (and why most support teams underestimate it)
Ask most support professionals what "ticket data" includes, and they'll likely mention customer satisfaction (CSAT) scores, response time, and volume. While accurate, it describes only the top layer of a much richer dataset. As the CEO and Founder of Mosaic AI says:
"You need a layer that turns unstructured data into structured signals." — Alon Talmor, CEO and Founder, Mosaic AI
Ticket data breaks into three distinct types:
- Structured metadata: Includes ticket priority, SLA status, channel, timestamps, assigned agent, and category tags. This is the data most analytics tools capture by default.
- Unstructured content: Includes ticket body text, reply threads, internal notes, and customer verbatims. This is where the real customer feedback and voice of the customer live.
- AI-enriched signals: Includes sentiment scores, intent classification, pain-point tags, escalation risk indicators, and customer churn signals derived from processing the unstructured content described above. This layer doesn't exist without AI, but it's where customer support analytics becomes genuinely predictive.
Understanding these three layers—and what each reveals about customer sentiment, needs, and the overall journey—makes it possible to analyze customer interactions strategically rather than just operationally.
The scattered data problem in complex B2B environments
According to Zylo’s 2026 SaaS Management Index report, the average enterprise has a portfolio of 305 SaaS applications. Support teams sit at the intersection of many of these applications, often without any unified view across the data, pulling not just from ticket data, but also from:
- Slack threads between a customer and their Customer Success Manager (CSM)
- Salesforce account notes from the last renewal call
- Confluence documentation explaining a workaround built months ago
- Email escalations that never made it into Zendesk
All of this is part of the support data picture and none of it is connected by default. This isn't a tooling failure. Sales needs Salesforce to manage the pipeline. Support needs Zendesk to manage customer tickets. Engineering needs Confluence to manage documentation. No one is consolidating onto a single platform, and that’s okay: Each system exists because it serves a specific workflow that no other tool handles as well.
But for any effort to use analytics to understand customer behavior at scale, this fragmentation matters. As my colleague, Josh Solomon, Mosaic AI's General Manager and VP of Revenue, puts it:
"Our tech stacks are absolutely insane. There isn't a single source of truth.” — Josh Solomon, Mosaic AI's General Manager and VP of Revenue
Why data quality is the foundation (and the failure point)
At scale, manual tagging isn't a sustainable process, and it was never designed to be. At high ticket volumes, even well-trained agents prioritize resolution speed over categorization precision, and rightfully so: They are putting the customer’s needs first.
However, the result is a dataset that reflects how the team operated under pressure, not necessarily what customers were actually experiencing. Categories drift, edge cases get lumped together, and historical data becomes an unreliable baseline for analysis. So if a trend report shows a spike in "billing issues," the first question should be: Did billing issues actually increase, or did a team lead remind agents to use that category more consistently last month, causing a recency bias?
AI-driven enrichment addresses this directly. By automatically classifying and scoring every ticket (regardless of how it was manually tagged), AI creates a consistent, clean dataset that analytical models can trust. Clean data isn't the exciting part of a support analytics strategy, but it's the part that everything else depends on.
From ticket data to CX strategy: A 4-step framework
The support teams that get the most from analytics aren't necessarily the ones with the most sophisticated tools. They're the ones with a repeatable system for turning signals into action.
Here's a setup for how that system works.
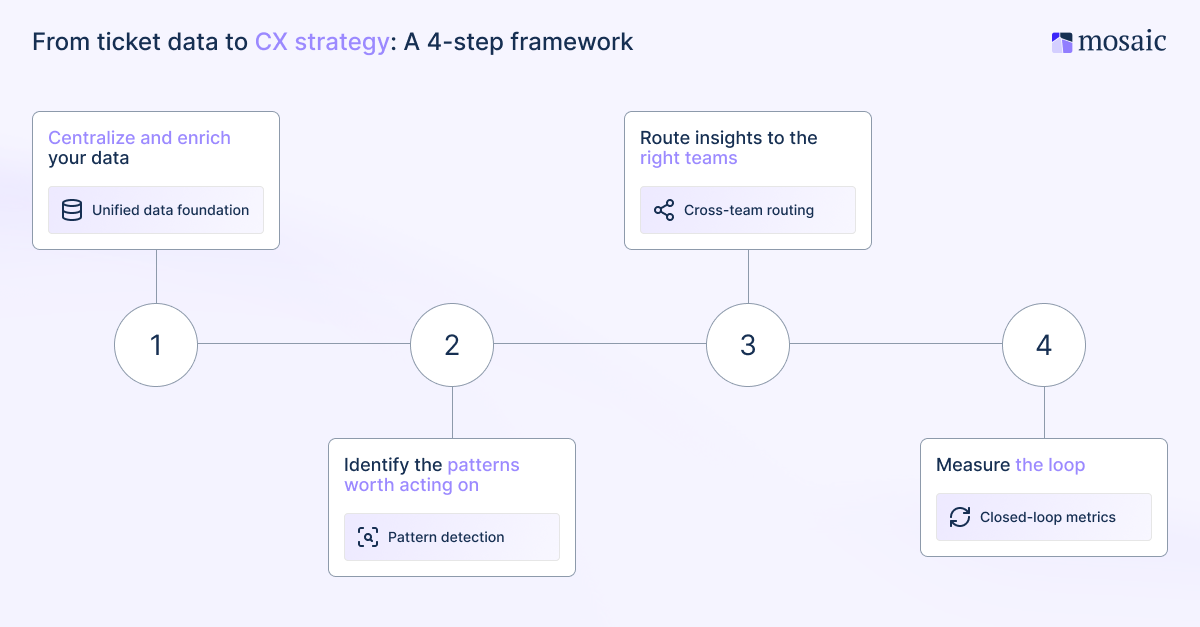
Centralize and enrich your data
Starting by consolidating: Connect your support platform, customer relationship management (CRM) system, and other knowledge bases so insights aren't siloed inside any single tool. Then apply AI enrichment to automatically classify, tag, and score every ticket across the unified dataset.
Mosaic AI connects to over 100 enterprise tools (e.g., Salesforce, Zendesk, Slack, Confluence, SharePoint, Snowflake, and more) providing a consolidated view of all customer interactions across the entire support org. That unified layer is what makes the steps below reliable.
Identify the patterns worth acting on
With clean, enriched support data in place, use clustering and trend analysis to surface recurring themes and emerging issues that are invisible at the individual ticket level but clear at scale.
In my experience, it’s best to prioritize by account impact (i.e., high-frequency issues affecting high-value accounts come first). The diagnostic question to ask here is: Is this a training issue, a product issue, a documentation gap, or a process failure? The answer determines who needs to act and whether the solution lies within the support team, the product org, or somewhere else entirely.
When that diagnostic question points to a documentation gap, Mosaic AI can automatically help close it. Rather than waiting for a manual content audit, the platform continuously clusters recurring cases, identifies where your knowledge base is missing coverage, and generates new content to fill those gaps. Now the next agent who encounters the same issue already has a reliable answer waiting in the wings.
Route insights to the right teams
This is the step most support analytics programs miss. Support intelligence that stays inside the support team isn't doing its full job.
Customer issues surfaced in the ticket queue are relevant to product roadmap decisions, customer success manager (CSM) renewal conversations, and executive account reviews. That connection only exists if there's a deliberate system for routing insights outward. Here are a few ways for support and other teams to better collaborate on this data:
- Set up product feedback loops
- Build CSM account health alerts
- Route escalation notifications to account owners, before anyone asks
For example, Mosaic AI's proactive alerting pushes signals directly to Slack or Microsoft Teams, so the right person knows about an at-risk account when the data first suggests a problem, not weeks later in a report.
Measure the loop
Define what success looks like before you begin. The metrics that matter for a strategic analytics program aren't the same as those on a standard SLA dashboard. Track the following for a better indicator that the framework is actually working:
- Reduction in repeat ticket rate
- Faster time-to-signal
- Fewer surprise escalations
- Improvement in customer sentiment scores on at-risk accounts
Most importantly: Track whether insights are actually reaching downstream teams and driving action. A dashboard nobody checks is simply a reporting artifact.
Key metrics for customer support teams track
To use analytics effectively, support leaders need to move beyond the SLA dashboard. Proactive support analytics starts with knowing which signals actually matter. For a more strategic and operational program, the metrics that reveal customer behavior and account health are:
- Sentiment trend by account: Is a specific customer getting more frustrated over time, even if their tickets are closing on time? CSAT measured at the ticket level misses slow-moving account degradation. Sentiment tracked longitudinally catches it early.
- Repeat ticket rate: How often does the same customer open tickets about the same issue? A recurring ticket that is deferred instead of solved tends to become an escalation.
- Escalation velocity: How quickly do tickets escalate, and which product areas or account segments drive it most? High escalation velocity in a specific area almost always points to a systemic issue rather than an individual agent performance issue.
- Ticket theme clustering: What are the top recurring issue categories this week versus last quarter? Emerging clusters often signal product changes, documentation gaps, or onboarding failures before they become widespread.
- Time-to-signal: How long between when a problem starts appearing in customer service data and when someone acts on it? This is the metric most teams never track, but it defines the difference between reactive and proactive support. A service manager who reduces time-to-signal by even a few days is running a fundamentally different operation.
5 metrics that move support teams from reactive to proactive
The five metrics above aren't equally urgent, and that's the point:
- Sentiment trend and time-to-signal determine whether your support analytics program is truly proactive.
- Repeat ticket rate and escalation velocity tell you where systemic problems are hiding.
- Ticket theme clustering is what connects individual case data to broader product and process decisions.
Together, they give support leaders a layered view: what's happening right now, what's trending over time, and what requires a cross-functional response. Analytics helps most when these metrics are tracked continuously rather than pulled as one-off reports. The patterns that emerge from consistent monitoring enable better customer experience decisions, such as flagging an account before a renewal conversation goes sideways or catching a product issue before it triggers a second wave of tickets.
How AI changes customer support analytics
Without AI, support analytics is primarily a reporting function: Customer service data is pulled after the fact, patterns are identified manually, and findings are shared in a weekly meeting. By the time the insight reaches the person who can act on it, the window to intervene has often already closed.
AI changes how this works in three specific ways:
- Enrichment at scale: Replaces inconsistent manual tagging with automatic classification across every ticket, creating a clean and consistent foundation for data analysis, while eliminating potential human error.
- Pattern detection across volume: Surfaces clustering trends across thousands of customer interactions simultaneously, catching emerging themes before they become entrenched problems.
- Proactive alerting over passive dashboards: Pushes the signal to the right person in real time, rather than waiting for someone to run a report from a rarely used dashboard.
The result is faster analysis and a different operating model. Actionable insights reach the right people when the data first signals a problem, enabling better customer service at scale. When teams consistently use analytics this way, customer retention and customer loyalty follow.
Best practices for AI-driven analytics aren't complicated: Start with data quality, connect the systems where signals actually live, and build routing that gets insights to the teams that can act on them. The use cases grow naturally from there.
What AI looks like in practice: Cynet case study
Cynet came to Mosaic AI with a familiar problem. Tickets were being resolved, but there was no system to better understand what the customer service data was actually saying at scale. The support team was reactive by necessity, managing volume without visibility into the underlying patterns.
After implementing Mosaic AI, Cynet achieved a 50% reduction in resolution time, 47% ticket deflection at Tier 1, and a 14-point CSAT lift, from 79 to 93.
That last number is the one worth pausing on. A 14-point CSAT improvement isn't an efficiency metric. It's a direct reflection of what happens when a team stops reacting to individual customer issues and starts acting on what the data (in aggregate) is telling them about customer expectations and the overall customer experience.
3 things that can derail your support analytics strategy
The framework above is straightforward. The execution isn't. These are the three obstacles that cause most support analytics programs to stall, even when the strategy is sound, and the tools are in place.
1. Data is more scattered than you think
The instinct when launching a support analytics initiative is to focus on what's inside the ticketing system, because that's the tidy, accessible part. But signals can also live in Slack, Salesforce notes, email threads, and Confluence documentation that never made it into the queue.
Accounting for the full data surface (not just the structured part) is what separates a real support analytics strategy from a better-looking dashboard. If the analysis only covers half of what’s out there, the actionable insights it produces will only be half accurate.
2. Dirty data produces muddy insights
Inconsistent manual tagging means trend analysis reflects categorization habits rather than customer reality. This is one of the most common failure points in support analytics programs, and one of the least discussed.
The fix isn't a tagging audit, though that helps in the short term. The sustainable solution is AI enrichment that removes the dependency on human consistency at scale. When every ticket is automatically classified using the same model, the dataset becomes reliable, while the data analytics built on top of it becomes trustworthy enough to act on.
3. Insights that stay in support don't protect revenue
The biggest missed opportunity in B2B support analytics isn't bad data. It's when good analysis never leaves the support organization.
In enterprise B2B, a support signal is a revenue signal. Rising frustration on an account, repeated friction with a specific product area, or an account that's suddenly gone quiet are all early indicators of customer churn. The CSM, the account executive, and sometimes the executive team need to know. And they need to know now to do something about it, not in next month's business review.
Support is almost always the first team to see these warning signs. Building a system that routes those signals outward to the people who can act on them transforms support analytics from an internal reporting function into a genuine driver of customer retention and loyalty.
Your ticket data already has the answers
Every support team already has the raw material for a smarter CX strategy. It's sitting in the queue right now as ticket threads, internal notes, customer sentiment shifts, and escalation patterns that nobody has had bandwidth to analyze systematically.
The difference between teams that use this data and teams that don't isn't access. It's having a system that enriches available data, surfaces the right patterns, and gets the signal to the right team before it becomes a problem.
That's what support analytics—done well—actually delivers: Better decisions made earlier by the people who can act on them. In B2B, where a single account can represent hundreds of thousands of dollars in annual recurring revenue, a stronger service experience at the account level isn't just a nice-to-have. It's a retention strategy.
Frequently asked questions
What is support analytics, and what data does it use?
Support analytics is the process of collecting, analyzing, and interpreting data generated by customer support interactions to improve team performance, customer experience, and business outcomes. That data comes from multiple sources: Structured metadata such as ticket priority and timestamps, unstructured content like reply threads and customer verbatims, and AI-enriched signals, including sentiment scores and churn risk indicators. In B2B environments, it also lives outside the ticketing system entirely, across CRMs, knowledge bases, and collaboration tools like Slack.
What is the difference between support analytics and customer service reporting?
Reporting tells you what happened: Ticket volume, response time, CSAT scores. Support analytics goes further, using diagnostic, predictive, and prescriptive analysis to explain why it happened, what's likely to happen next, and what your team should do about it. The distinction matters because reporting is always backward-looking, while analytics can be the difference between catching a churn signal early and discovering it on a renewal call.
How does support analytics help reduce customer churn?
In B2B, churn rarely happens without warning. The signals appear in support data first as declining sentiment, repeated friction in a specific product area, or an account that's gone unusually quiet. Support analytics surfaces those patterns before they become escalations or lost renewals, giving customer success managers (CSMs) and account teams the context they need to intervene early. Teams that proactively route these insights, rather than leaving them in the support queue, consistently achieve stronger retention outcomes.
How do you know if your support data is clean enough to analyze?
Start with a quick diagnostic: Pull your top ticket categories for the last 90 days and ask whether they reflect what customers are actually experiencing, or how your team has been trained to tag. If categories are inconsistent, overly broad, or clearly influenced by recent process changes, the data isn't reliable enough to build a strategy on. The sustainable fix isn't a tagging audit; it's AI enrichment that automatically classifies every ticket using a consistent model, removing the dependency on human consistency at high volume.
What metrics should a support analytics dashboard include?
Beyond the standard service-level agreement (SLA) dashboard, a strategic support analytics program should track sentiment trends by account, repeat-ticket rate, escalation velocity, ticket theme clustering, and time-to-signal. The first and last of those are the most important: Sentiment trend catches slow-moving account degradation before it surfaces as an escalation, and time-to-signal measures the gap between when a problem appears in your data and when someone acts on it. Together, these metrics shift support analytics from a reporting function into an early warning system.


